Live Chat Reporting in Odoo 15
Reporting
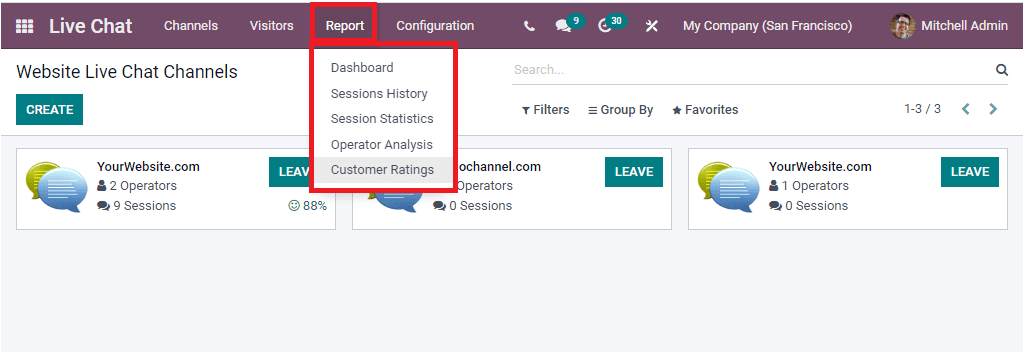
La pestaña de informes del módulo de chat en vivo de Odoo incluye varios submenú como Panel de control, historial de sesiones, estadísticas de sesión, análisis de operadores y clasificaciones de clientes para generar
The Dashboard menu available under the Reporting tab allows you to have Dashboard analysis.
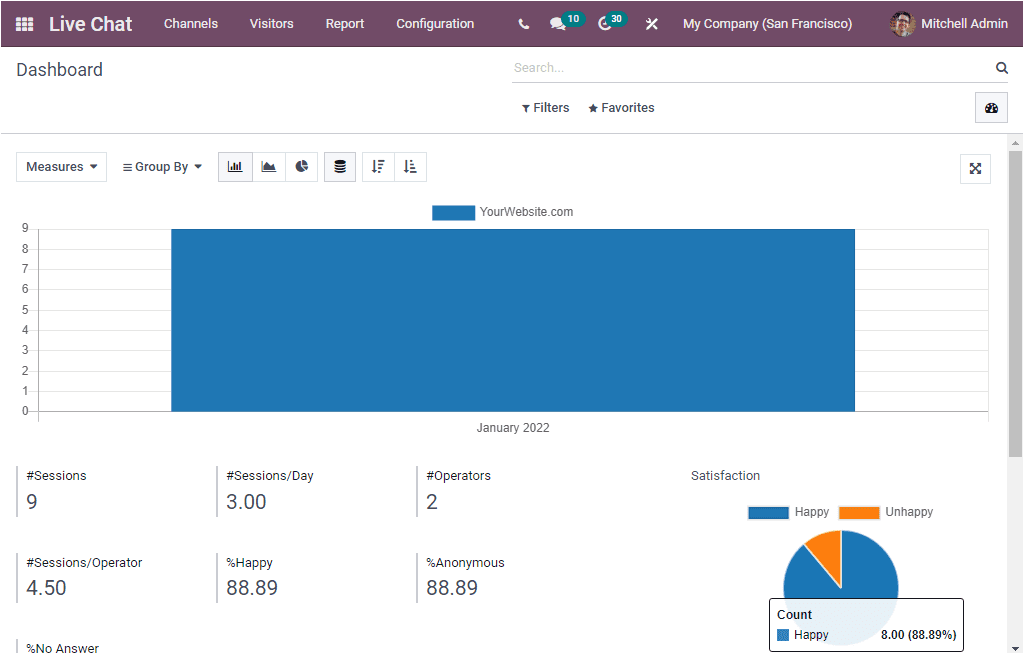

Here, you can view the reports in graphical analysis, tabular format, and direct analysis.
Sessions History
The Sessions History menu available in the Reporting section gives reports of all the sessions created in the Live Chat module.
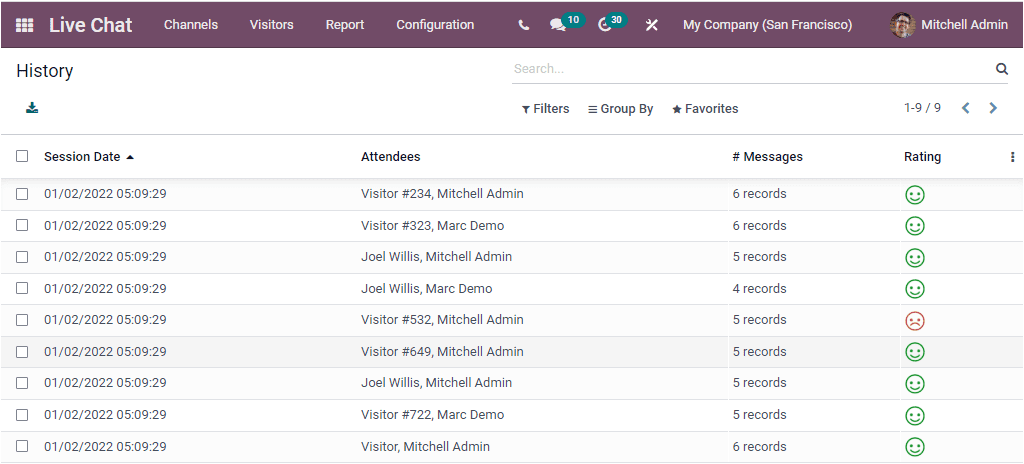
The above window will depict the Session History window, and here you will get all the session histories created in the platform. The window will point out the vital information of each session's histories such as Session Date, Time, Attendees, Number of Messages, and Rating.
Session Statistics
The Session Statistics window will give you all the session statistic reports in both Graph and Pivot views. The graphical representation of the Session Statistics window is depicted below.
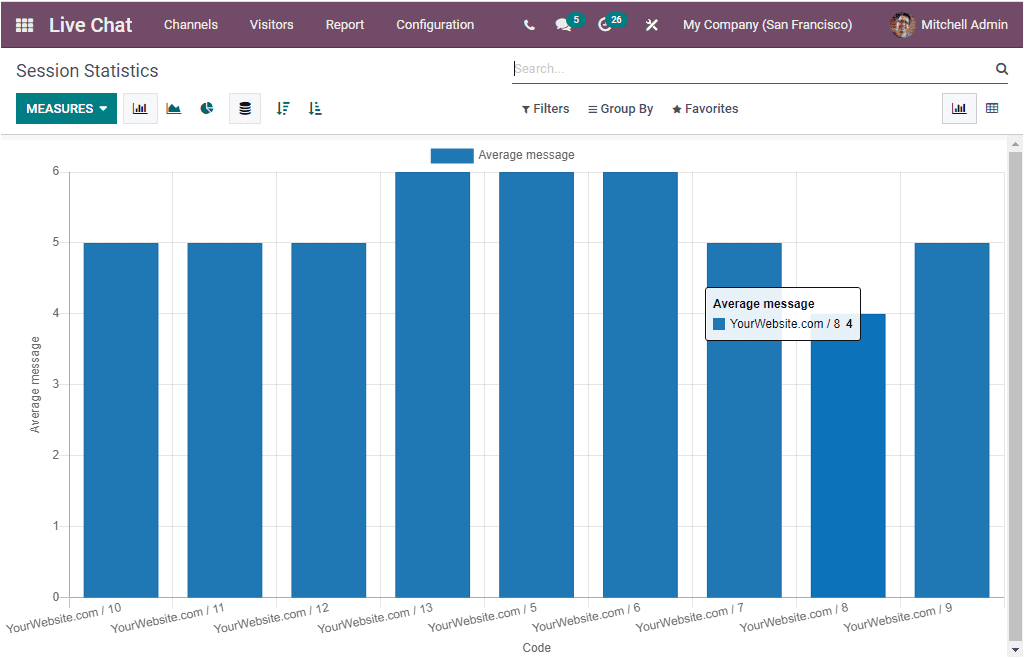
This is the Bar Chart representation of the window, and you can also view it in Line Chart and Pie Chart. The Session statistics report can be viewed in different measures. To change the measures of the graph, you can click on the MEASURES tab. Now you will depict a list of measures as shown in the image below.
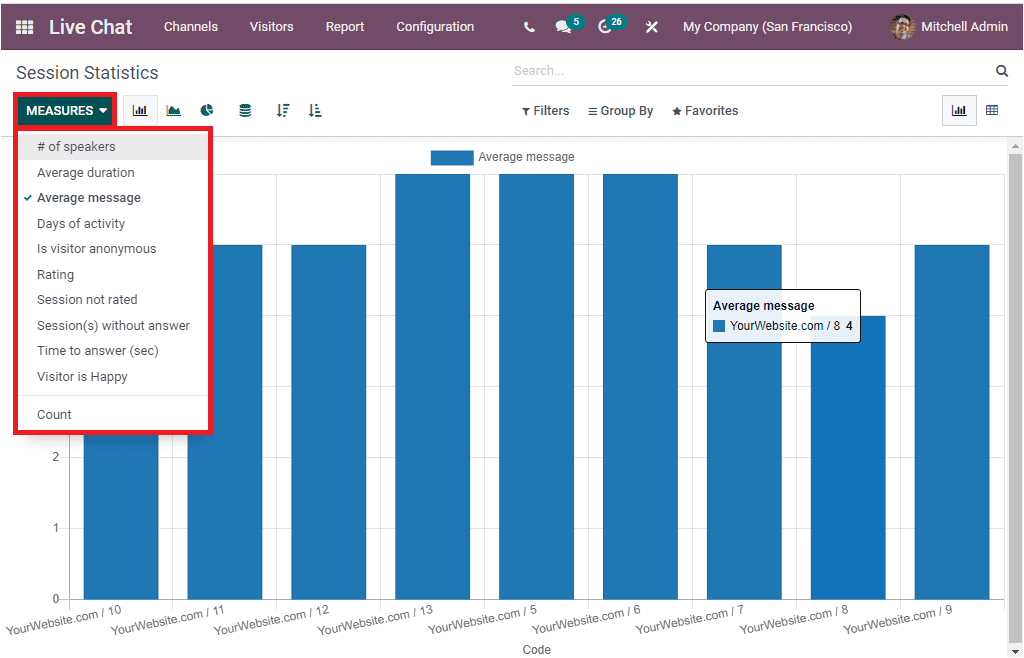
The MEASURES tab includes the options such as the Number of speakers. Average Duration, Average message, Days of activity, Is visitor anonymous, Rating, Session not rated, Session not rated, Session(s) without answer, Time to answer, and Visitor is Happy.
In addition the window includes various default as well as customizable filtering and grouping options that will allow you to sort out the required data from the whole list. The default filters available under the Filters tab are Missed Sessions, Treated Sessions, Last 24h, This Week, Start Date of the session( month, quarter, and year). Similarly, the default options available under the Group By section are Code, Channel, Operator, Creation Date (hour), Creation Date( Year, Quarter, Month, Week, and Day).
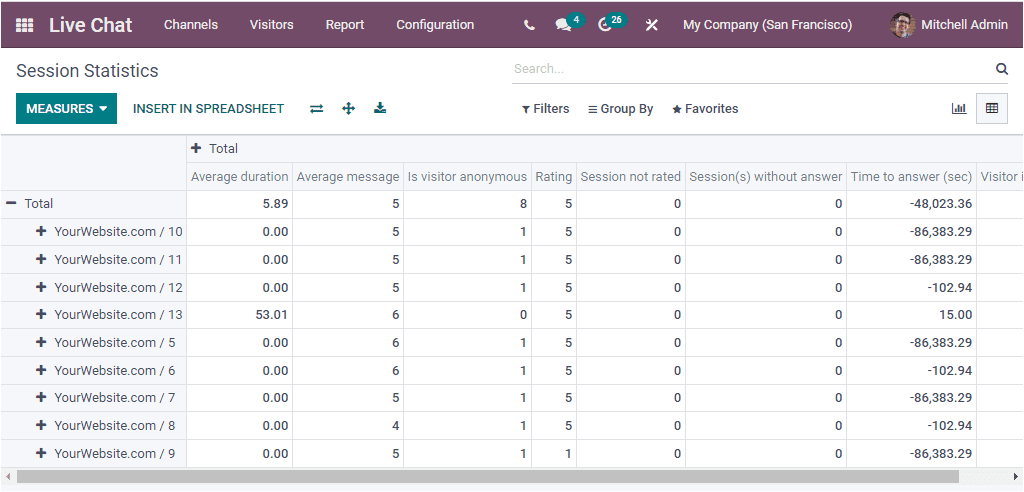
Now let us look at the Pivot view of the Session Statistics window. Or viewing this, you can click on the Pivot menu icon available on the top right corner of the window.
Operator Analysis
The Operator Analysis menu available in the Reporting section of the Odoo Live Chat module will allow you to generate reports of Live Chat based on live chat operators. The Operator Analysis window can also be viewed in Graph and Pivot view.
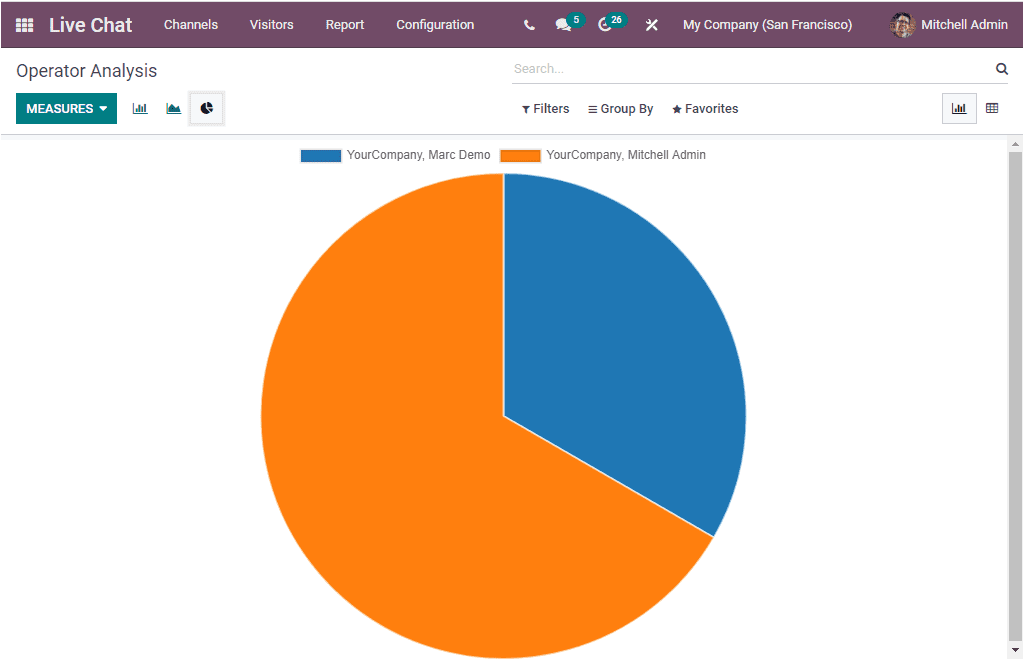
The above image depicts the Pie Chart representation of the window. You can also view the window in Bar, Line, and Pie Charts. The MEASURES tab available in the window includes the Number of Sessions, Average Duration, and Time to Answer. You can also apply various default and customizable, FilterS, Group By options, Favourites, and Search options.
Customer Rating
The Customer Rating menu available under the Reporting tab of the Odoo Live Chat module enables you to record all the responses received from the website visitors according to the interaction between the company representative and visitors. You can click on the Customer Rating menu to access the Customer Rating window.
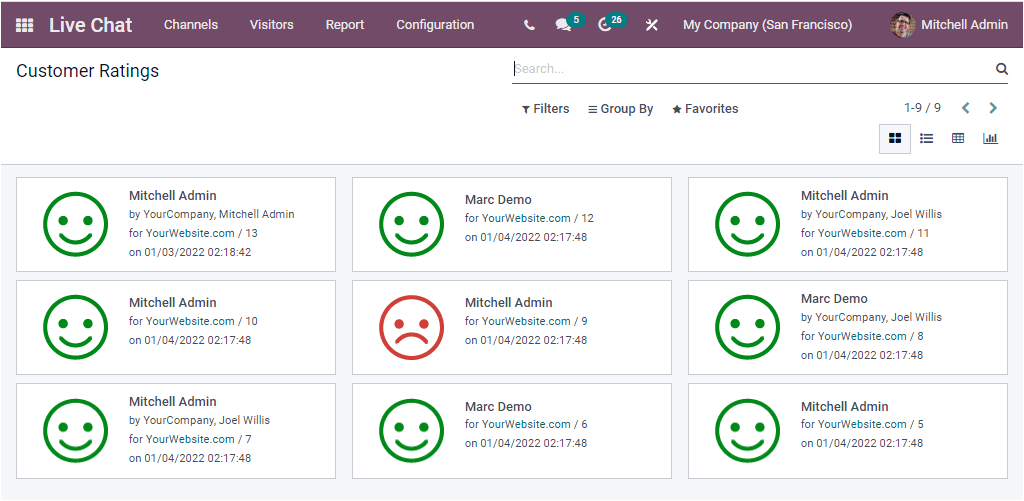
Here you can view all the analysis reports of the customer ratings on Kanban view. You can also view the report in List, Pivot, and Graph view. Gathering ratings from the visitors will help you to analyze, improve and strengthen your company's interaction with customers. This window also provides you with various default and customizable filters, grouping options, and searching facilities. You can access the options under the respective tabs.
The Odoo ERP delights the customers with a fruitful Live Chat module that can be considered as the quickest and most efficient strategy for customer interaction. This is the unique and perfect way to enhance your customer services.